River Study: Riera de Ribes
How and why does the flood risk vary between the north and south of the Sant Pere de Ribes area of Barcelona?
Background
Sant Pere de Ribes, a small town to the west of Barcelona, is delimited to the north and west by the Riera de Ribes, a river with a typical Mediterranean regime. This river is normally dry during the summer months, but is subject to flash flooding which is most common during the Autumn. A notch on a river cliff to the north of the town provides evidence of a past flood level. The hydraulic radius, gradient and Manning n can be used to calculate the discharge for the flood event and to analyse the flood risk posed by the river, both in the vicinity of the river cliff and further downstream. The risk to recent housing and camp site developments on the river floodplain can be assessed together with the effectiveness of river management schemes. Other factors that affect the flood risk, such as increased urbanisation, forest fires, changing agricultural land use, drainage density, drainage basin shape, reforestation, etc. can be analysed with the aid of secondary data.
Tasks: Site 1
1. Measure the river cross-section using the flood notch as the water level. Use a topochaix line secured with ranging poles at both ends, levelled (using an abney level) with the flood notch. This line marks the flood level. Measure the channel depth (using a calibrated surveying pole and plumb line) between the river bed and this line at 5m intervals and at every change of slope. Distances across the river should be measured using a measuring tape. See diagram below:
Record on Data Chart 1.
2. Identify the n value for Manning's co-efficient. This measures friction or the resistance of the channel to river flow. This depends upon the nature of the bed and bank material, vegetation cover and sinuosity of the channel. Circle which one of the categories below best your river cross section: only circle one value.
|
|||||||||||||||||||
3. Channel Gradient
Record the channel gradient using an abney level as shown in the photograph below:
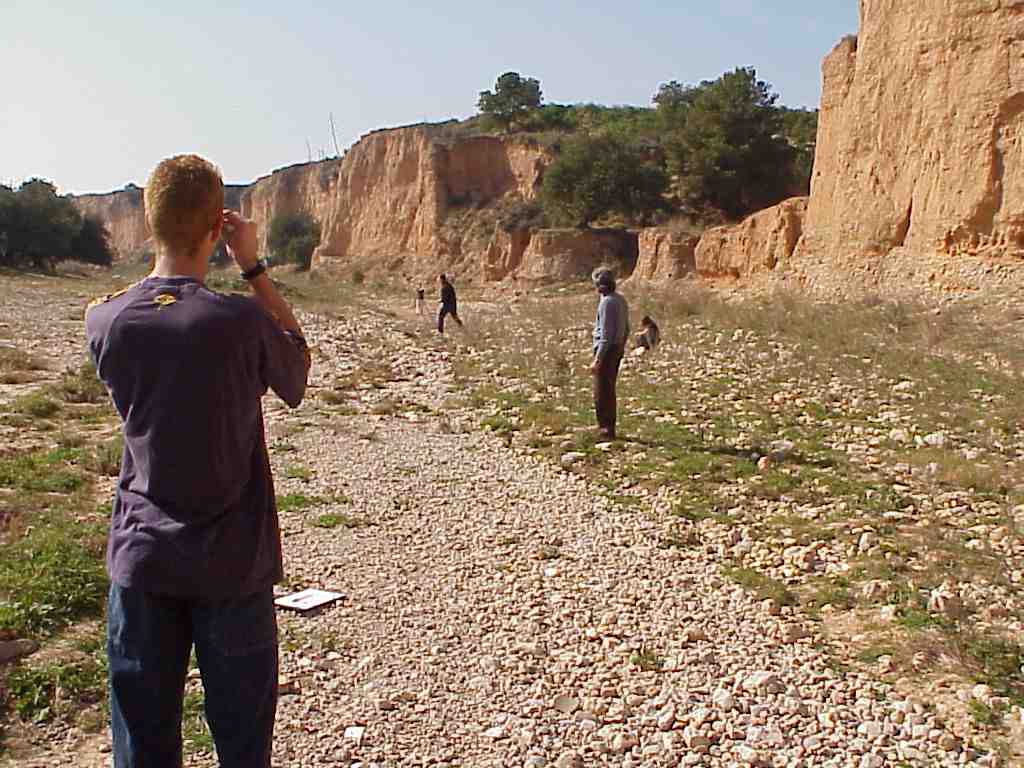
Record on Data Chart 2
4. Field Sketch
You will need to draw a field sketch looking up the river channel towards your cross-section study site. This will require clear and detailed annotation as follows:
- Evidence of management/flood prevention
- Land use adjacent to the river channel
- Vegetation size and type
- Bed load (shape/size)
- River landforms: river cliff, terraces
- Rock type
Record on Data Chart 3
5. Land Use Maps
Annotate the land use map using the following categories:
- Residential
- Agricultural
- Recreational
- Transport/communication
- Industry
- Flood prevention schemes
- Natural vegetation
- Current building works
Tasks: Site 2
1. Measure the river cross-section using bank-full as the water level. Use a topochaix line secured with ranging poles or vegetation at both ends, levelled (using an abney level). with the top of the river bank. This line marks bank-full. Measure the channel depth (using a calibrated surveying pole and plumb line) between the river bed and this line at 5m intervals and at every change of slope. Distances across the river should be measured using a measuring tape. See diagram below:
Record on DATA CHART 1
2. Identify the n value for Manning's co-efficient. This measures friction or the resistance of the channel to river flow. This depends upon the nature of the bed and bank material, vegetation cover and sinuosity of the channel. Circle which one of the categories below best your river cross section: only circle one value.
|
|||||||||||||||||||||||||||||||||||||||||||||||||||||||||||
3. Channel Gradient
Record the channel gradient on Data Chart 2 using the same method as for site 1.
4. Field Sketch
Record on Data Chart 3 using the same method as for site 1.
5. Land Use Maps
Annotate the land use map using the same method as for site 1.
DATA CHART 1: RIVER CROSS-SECTION DATA
|
||||||||||||||||||||||||||||||||||||||||||||||||||||||||||||||||||||||||||||||||||||
|
|
||||||||||||||||||||||||||||||||||||||||||||||||||||||||||||||||||||||||||||||||||||
|
||||||||||||||||||||||||||||||||||||||||||||||||||||||||||||||||||||||||||||||||||||
DATA CHART 2: CHANNEL GRADIENTS
|
||||||||||||||||||||||||
Riera de Ribes flash flood case study